Power BI templates for project controls
Four report templates for the questions every project meeting asks: are we on plan, which milestones slip, who owns what, and what happens in the next three weeks. Free, MIT licensed, each one fed by a single Excel workbook. Source on GitHub (MIT).
Your data in 3 steps
- 1Download
Take the template and its sample workbook from the card below. Save both in one folder, for example
C:\PowerBI-Templates\progress-s-curve\. - 2Fill the Excel
Replace the sample rows with yours. Keep every sheet name and every column header as they are; the README sheet explains each column. Add rows freely.
- 3Point DataFile, refresh
Unzip, open the
.pbip, then Home, Transform data, Edit parameters. Paste the full path of your workbook inDataFile, OK, then Refresh.
DataFile is a Power Query parameter that holds the full path of the workbook, such as D:\Projects\Plant\sample_data.xlsx. Power BI cannot read a path relative to the report, so the full path is the one setting to change. Move or rename the workbook later: edit the parameter again and refresh. Tip: in File Explorer, Shift + right-click the workbook and choose Copy as path, then remove the quotes.
Progress S-curve
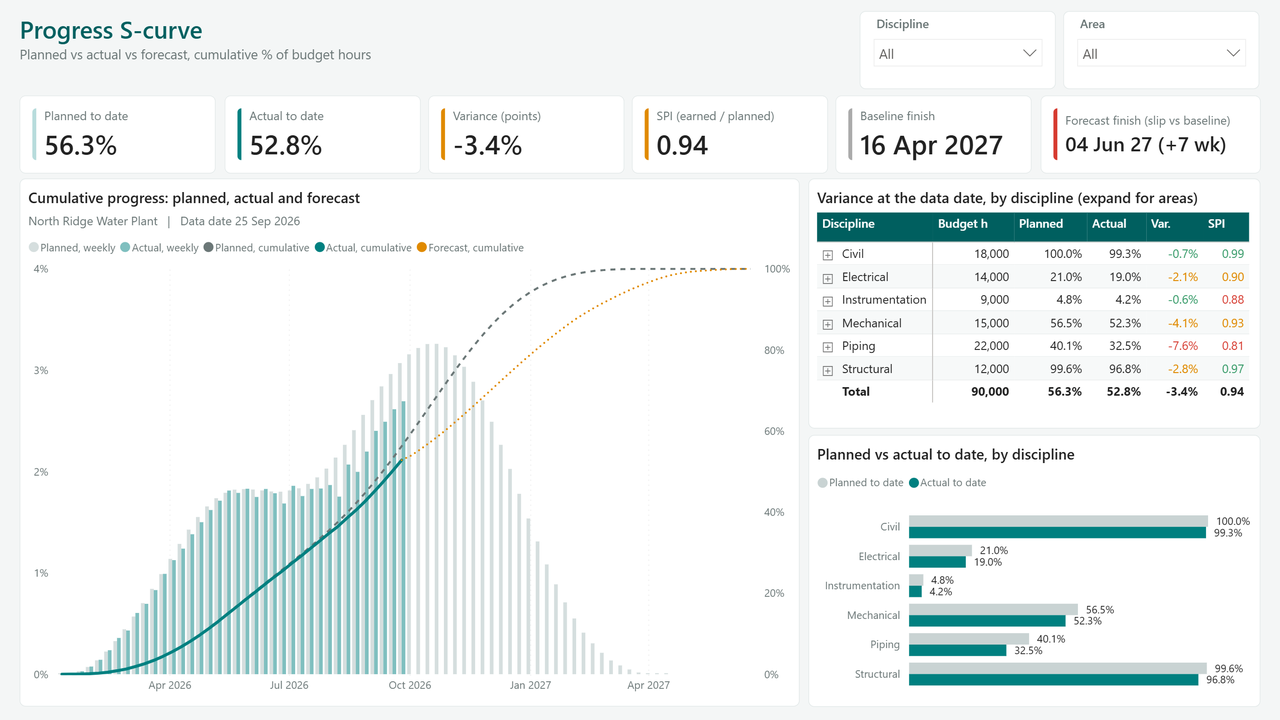
Are we ahead or behind the baseline, by how much, and where does the forecast land?
Who and whenProject controls and planning engineers, for the weekly progress report and the monthly client report.
What it shows
- Planned, actual and forecast cumulative % of budget hours, week by week, with weekly bars under the curves
- Planned to date, actual to date, variance in points and SPI at the data date
- Baseline finish against forecast finish, with the slip in weeks
- Variance table by discipline, expandable to area, SPI in traffic-light colours
Column dictionary
| Sheet | Column | Type | What to enter |
|---|---|---|---|
| Settings | Project Name | Text | Project name shown in the report header. |
| Settings | Data Date | Date | Status date (cut-off). Actuals count up to this date. Leave empty to use today. |
| Progress | Week Ending | Date | Last day of the reporting week. Same weekday on every row. |
| Progress | Discipline | Text | Discipline or trade. Drives the slicer and the variance table. |
| Progress | Area | Text | Area, unit or work front. |
| Progress | Planned Hours | Number | Baseline hours planned to be earned that week. All weeks of a discipline and area add up to its budget. |
| Progress | Earned Hours | Number | Hours earned that week (budget x progress gained). Up to the data date only. |
| Progress | Forecast Hours | Number | Hours you expect to earn that week. After the data date only. |
Milestone tracker
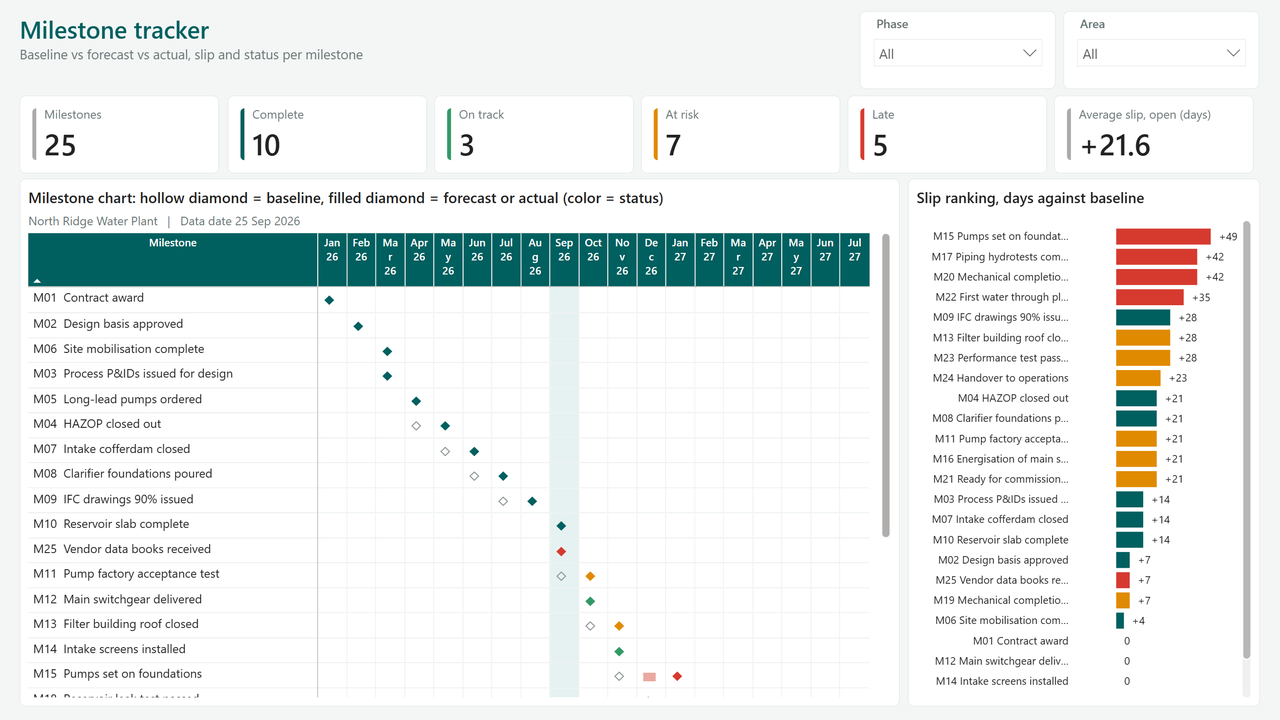
Which milestones are slipping, by how many days, and which ones are already late?
Who and whenProject managers and planners, for the steering committee and the client milestone review.
What it shows
- Milestone chart by month: hollow diamond on the baseline month, filled diamond on the forecast or actual month, coloured by status
- Counts of complete, on track, at risk and late milestones, and the average slip of the open ones
- Slip ranking in days against the baseline
- A second page with the full register: dates, slip and status per milestone
Column dictionary
| Sheet | Column | Type | What to enter |
|---|---|---|---|
| Settings | Project Name | Text | Project name shown in the report header. |
| Settings | Data Date | Date | Status date. A milestone forecast before this date and not achieved is Late. |
| Settings | Late Threshold Days | Whole number | Slip above which an open milestone is Late instead of At risk. Default 30. |
| Milestones | Milestone ID | Text | Unique code. |
| Milestones | Milestone | Text | Short name. |
| Milestones | Phase | Text | Engineering, Procurement, Construction, Commissioning, Handover or your own list. |
| Milestones | Area | Text | Area or unit. Site-wide for project-level milestones. |
| Milestones | Owner | Text | Role or person accountable. |
| Milestones | Baseline Date | Date | Date in the approved baseline. Frozen. |
| Milestones | Forecast Date | Date | Current forecast, updated every week. |
| Milestones | Actual Date | Date | Date achieved. Empty while open. |
RACI and responsibility matrix
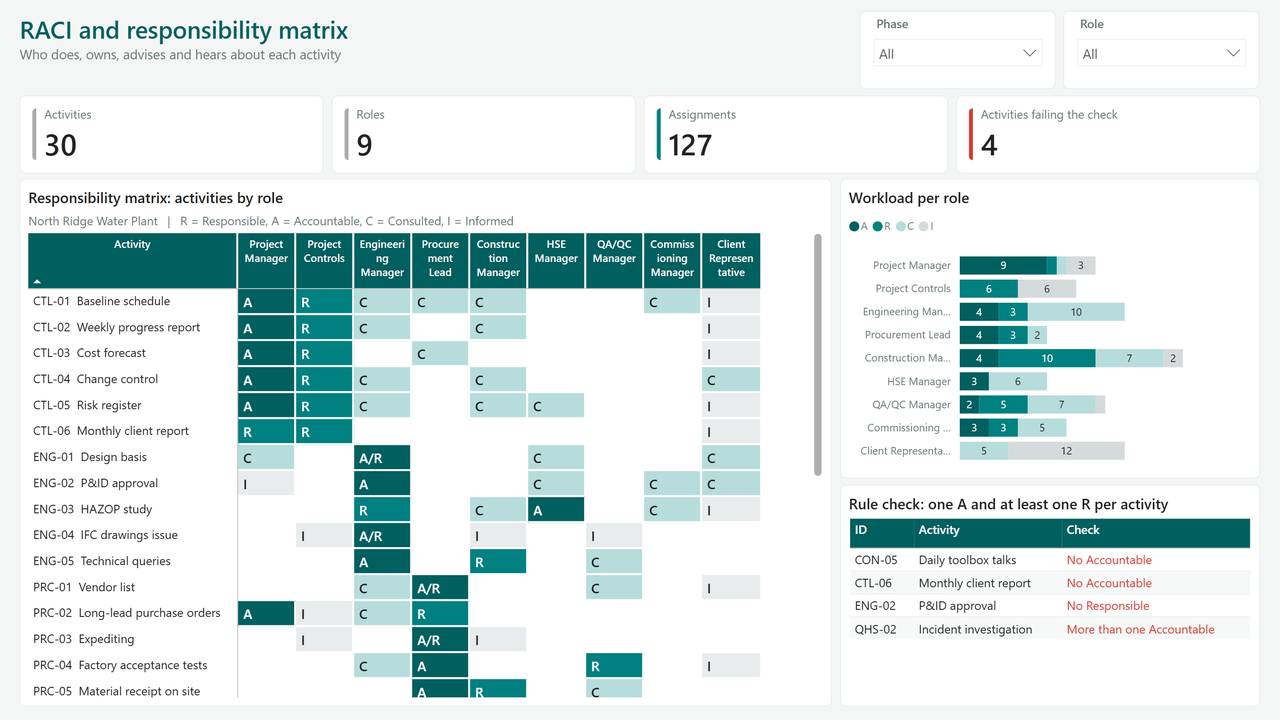
Who does, owns, advises and hears about each activity, and where is ownership broken?
Who and whenProject managers and interface managers, at kick-off, at each organisation change and before an audit.
What it shows
- The matrix itself, activities by role, each cell coloured by code
- Workload per role: how many A, R, C and I each role carries
- A rule check that lists every activity with no Accountable, more than one Accountable, or no Responsible
- Filters by phase and by role
Column dictionary
| Sheet | Column | Type | What to enter |
|---|---|---|---|
| Settings | Project Name | Text | Project name shown in the report header. |
| RACI | Activity ID | Text | Unique activity code. Sets the row order. |
| RACI | Activity | Text | Activity or deliverable. |
| RACI | Phase | Text | Phase, process or work package. |
| RACI | one column per role | Text | Header = role name. Cell = R, A, C, I, or two codes such as A/R. Empty = not involved. Add or remove role columns freely. |
3-week look-ahead
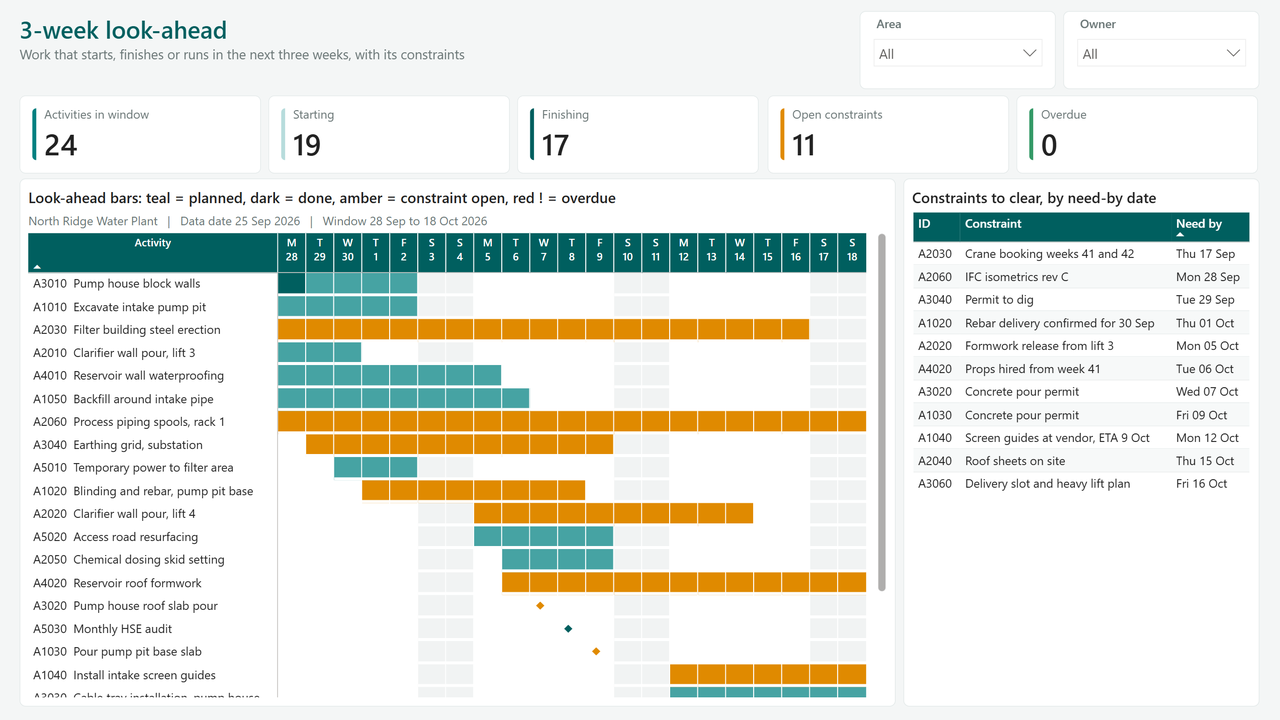
What work starts, finishes or runs in the next three weeks, who does it, and what could stop it?
Who and whenConstruction managers, site planners and supervisors, for the weekly coordination meeting.
What it shows
- A day-by-day bar chart of the window: done part in dark teal, remaining in teal, amber when a constraint is still open
- Overdue work flagged in red on the first day
- Counts of activities in the window, starting, finishing, with open constraints, overdue
- The constraint list sorted by need-by date, filtered by area and owner
Column dictionary
| Sheet | Column | Type | What to enter |
|---|---|---|---|
| Settings | Project Name | Text | Project name shown in the report header. |
| Settings | Data Date | Date | Status date. The window starts on the Monday after it. |
| Settings | Look-ahead Weeks | Whole number | Length of the window. Default 3. |
| Activities | Activity ID | Text | Activity code, as in the schedule. |
| Activities | Activity | Text | Activity name. |
| Activities | Area | Text | Area or work front. |
| Activities | Owner | Text | Crew, subcontractor or person. |
| Activities | Start Date | Date | Planned or actual start. |
| Activities | Finish Date | Date | Planned or forecast finish. Same as Start for a one-day task. |
| Activities | % Complete | Number 0 to 1 | Physical progress. At 1 the activity drops out. |
| Activities | Constraint | Text | What must be cleared first. Empty once cleared. |
Apply your brand
The templates ship with KATA, a quiet teal theme built for weekly status decks. To swap it for your company colours, build a theme with the Theme Builder, check its contrast with Theme Check, then in Power BI Desktop go to View, Themes, Browse for themes and pick your JSON file. Status colours (green, amber, red) come from DAX measures, so they stay readable whatever palette you apply.
- Budget = sum of Planned Hours over all weeks of the selection. The baseline curve therefore ends at 100%.
- Planned % cumulative at week w = planned hours with Week Ending up to w / budget.
- Actual % cumulative = earned hours up to w / budget, shown only up to the last week ending on or before the data date.
- Forecast % cumulative = (earned hours to the data date + forecast hours after it, up to w) / budget. It starts where the actual curve stops, so the two lines join.
- SPI = earned hours to date / planned hours to date. The hours are the earned value and the planned value of the method, so 1.00 means on plan and 0.90 means 10% of the planned work is not done. Green from 0.95, amber from 0.90, red below.
- Variance = actual % to date minus planned % to date, in percentage points.
- Forecast finish = first week where the forecast curve reaches 99.9% of the budget. Slip = forecast finish minus the last week with planned hours, in weeks.
- Milestone slip = (actual date, or forecast date while open) minus baseline date, in calendar days. Complete = actual date filled. Late = open and forecast before the data date, or slip above Late Threshold Days. At risk = slip above zero. On track = the rest.
- RACI check: each activity needs exactly one A and at least one R. Zero A, two A or zero R puts it on the check list.
- Look-ahead window = the Monday after the data date plus Look-ahead Weeks x 7 days. An activity shows when it is below 100% and starts before the window ends, so overdue work stays visible until it is closed.